
Every reading from every round is stored, so you can look at a single log, follow one reading across months of logs, and export the results as a report. This article walks through all three, using a weekly inspection round on a cooling water pump as the example.
Step 1: Find the logs
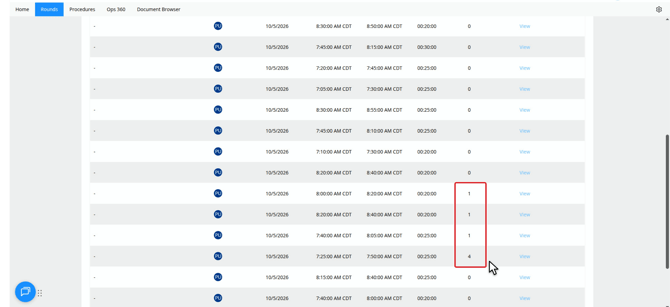
- Open Rounds and click the round you want. The round dashboard opens and shows how many logs have been completed.
- Click the Logs tab to see every log for the round.
The Issues column counts the out-of-range items in each log, so you can quickly find the logs that need attention. Click a log to open it.
Step 2: Read a log
The top of the log shows its date and where it falls in the round's history (for example, log 16 of 20).
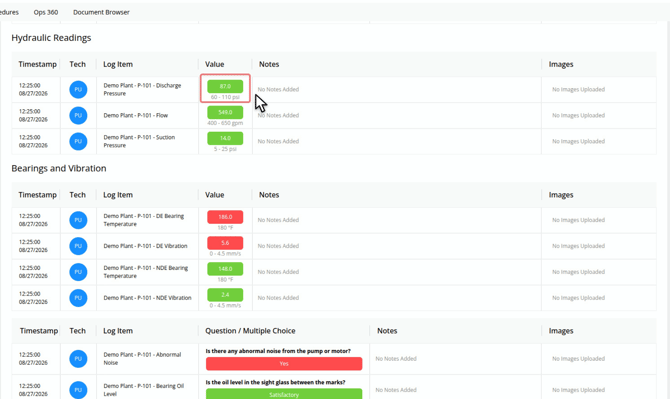
Each reading shows its safe range underneath:
- Green: the reading is within range. For example, a discharge pressure of 87 psi with a range of 60 to 110.
- Red: the reading is out of range. For example, a bearing temperature of 186 degrees against a limit of 180.
Answers can be out of range too. If an operator answers a multiple-choice question such as "Abnormal noise?" with an answer marked as out of range, it shows in red like a reading.
Text answers record what was found and what was done, such as "Grinding noise at the bearing, maintenance request MR0412 to replace it."
Use Previous Log and Next Log to move through the logs in order.
Step 3: Follow a reading over time
Trends
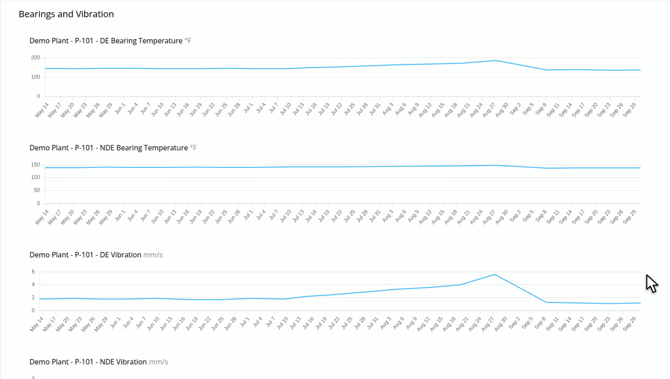
The Trends tab on the round dashboard charts every reading on the round across all of its logs.
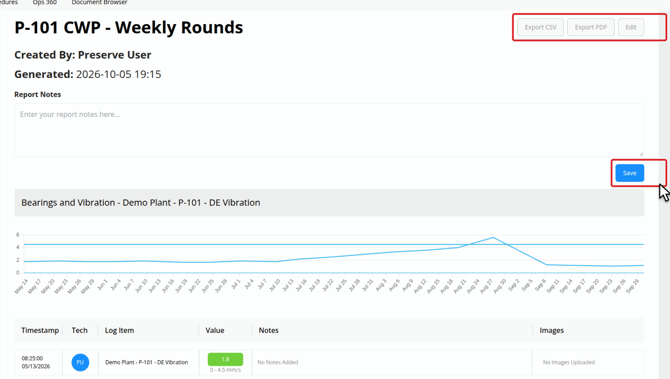
For example, a pump's vibration chart might hold steady for months, then rise every week until it crosses the limit. After the bearing is replaced, it drops back to its normal level. Seeing the rise early gives you weeks of warning before a reading goes out of range.
Visualize
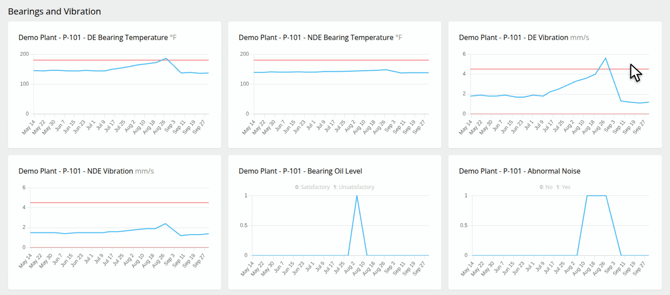
Visualize shows the same charts for a round and a date range you choose, with each limit drawn as a red line. Hover over any point to see its exact date and value.
Readings and answers are charted side by side, so you can see how they relate. In the pump example, the oil level and abnormal noise answers changed before vibration crossed its limit.
Step 4: Create and export a report
- On the round dashboard, click Generate.
- Choose the dates and the round items to include.
- The report shows a chart and each value for the items you picked. Save it.
- Export the saved report as a CSV or PDF.
Exporting from a log
Each log page also has two exports:
- Print Report makes a PDF of that one log. It starts with the log details (date, start and finish times, and who logged it), then lists every item by section with its value and range. Out-of-range values print in red, just like on screen.
- Export CSV downloads every log on the round, not just the one you're viewing. The CSV has one row per item per log, with the value, its limits, and an Out of Range column.
💡 Need the full history of a round in a spreadsheet? Export CSV from any log gets you every log at once